
Many systems are not optimized or sub-optimized by tweaking the wrong features. This post describes the use of the Visual Studio 2012 profiler to get insight in what to optimize and monitor the result of these optimizations.
For this post I’ll use a simple service that reads the contents of a file, deserializes the contents and returns the requested record. Testing is done with a second console app that creates 10 tasks that run for 10 seconds and request as much records as possible. Code below, details omitted for breviary.
// 1. load the file
using (var file = File.OpenRead(fileName)) {
    using (var reader = new StreamReader(file)) {
        content = reader.ReadToEnd();
    }
}
// 2. deserialize data
using (var reader = new StringReader(content)) {
    var serializer = new XmlSerializer(typeof(DataRecord[]));
    records = (DataRecord[])serializer.Deserialize(reader);
}
// 3. find record
var record = records.Where(x => x.Key.Equals(key))
                    .FirstOrDefault();
if (record != null) result = record.Value;
var tasks = Enumerable.Range(1, 10)
                      .Select(x => Task.Factory.StartNew(
                      () => {
    var count = (long)0;
    var timer = Stopwatch.StartNew();
    // run for 10 seconds
    while (timer.ElapsedMilliseconds < 10000) {
        using (var proxy = new Proxy(binding, address)) {
            var value = proxy.GetValue(key);
        }
        count++;
    }
    Console.WriteLine("Repeated test {0:10} times", count);
})).ToArray();
Task.WaitAll(tasks);
Not optimized
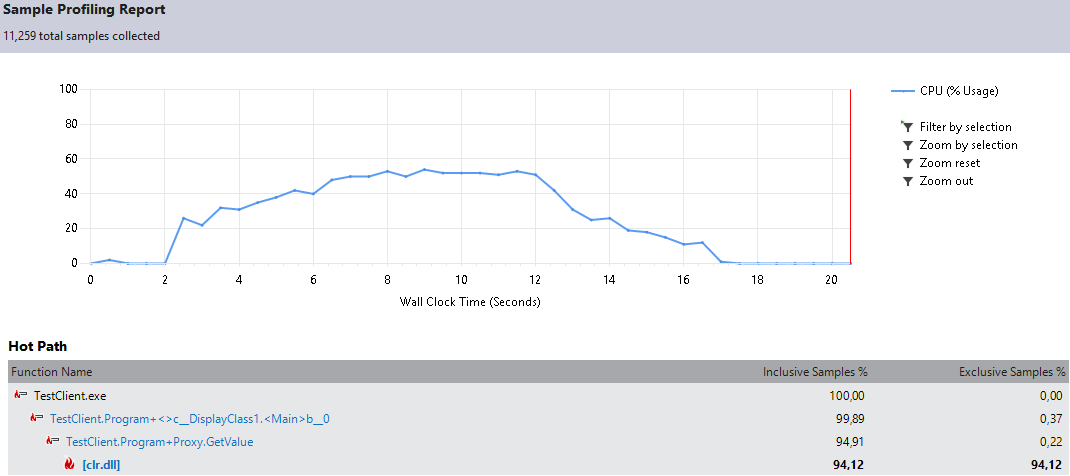
First up is the default implementation of the program. Total 11459 calls in 10 seconds.

My machine peaks at 80% and the profiler shows hot path of a framework operation inside the service GetValue implementation.
Cache file
Disk IO is slow. First change is caching the file in memory after it is read. Code changes below.
// thread safe synchronization object
private static object sync;
// constructor to initialize sync object
static DataRecordService() {
  sync = new object();
}

// part of GetValue operation
var cache = MemoryCache.Default;
content = (string)cache.Get(fileName);
if (string.IsNullOrEmpty(content)) {
    lock (sync) {
        content = (string)cache.Get(fileName);
        if (string.IsNullOrEmpty(content)) {
            // 1. load the file
            using (var file = File.OpenRead(fileName)) {
                using (var reader = new StreamReader(file)) {
                    content = reader.ReadToEnd();
                }
            }
            // add file to cache
            var policy = new CacheItemPolicy() {
                SlidingExpiration = TimeSpan.FromSeconds(2)
            };
            cache.Set(fileName, content, policy);
        }
    }
}

Now the total is 12315 in 10 seconds. The peak is still at 80% but it comes later and the decline does not stall at 25%. Now the hot path points to the proxy in the client.
Reuse proxy
Best practice is to create a new proxy for every call, but for this optimization I now reuse the proxy for all calls per task. This brings the total to 13126 in 10 seconds.
var proxy = new Proxy (binding, address);
while (timer.ElapsedMilliseconds < 10000) {
    //using (var proxy = new Proxy(binding, address)) {
        var value = proxy.GetValue(key);
    //}
    count++;
}

The peak gets below 80% and the incline/decline are less steep. Now the hot path tells to look at the XML serialization of the service.
Cache deserialized records
As we cache the file contents, we can cache the deserialized records. The result would be the same anyhow. Now the calls get to 14588 per 10 seconds and the peak is 50%. The biggest difference so far.
records = (DataRecord[])cache.Get("records");
if (records == null) {
    lock (sync) {
        records = (DataRecord[])cache.Get("records");
        if (records == null && string.IsNullOrEmpty(content) == false) {
            using (var reader = new StringReader(content)) {
                var serializer = new XmlSerializer(typeof(DataRecord[]));
                records = (DataRecord[])serializer.Deserialize(reader);
            }
            var policy = new CacheItemPolicy() {
                SlidingExpiration = TimeSpan.FromSeconds(2)
            };
            cache.Set("records", records, policy);
        }
    }
}
The hot path is in the framework on the client.
NetTcpBinding
We’ll change the binding from BasicHttpBinding to NetTcpBinding. Both ends use the dotNET framework and the binary binding is faster as the more generic Http. The code change is minimal thanks to WCF. Both the Service and the Client need to change. The number of calls sticks to 14931 per 10 seconds, but the system is no longer “under stress”.
//var address = "http://localhost:8044/datarecord.svc";
//var binding = new BasicHttpBinding();
var address = "net.tcp://localhost:8044/datarecord.svc" ;
var binding = new NetTcpBinding();

The hot path shows no real optimizations left as the number behind the path is very low. (4,36)
Conclusion
Using the VS2012 profiler we got the test to service from 11459 to 14931 calls and lower the system resources needed for this. Keep in mind that not every change is without pitfalls like caching fast changing files or reusing proxies. Make sure to run the system with production like load before releasing.
