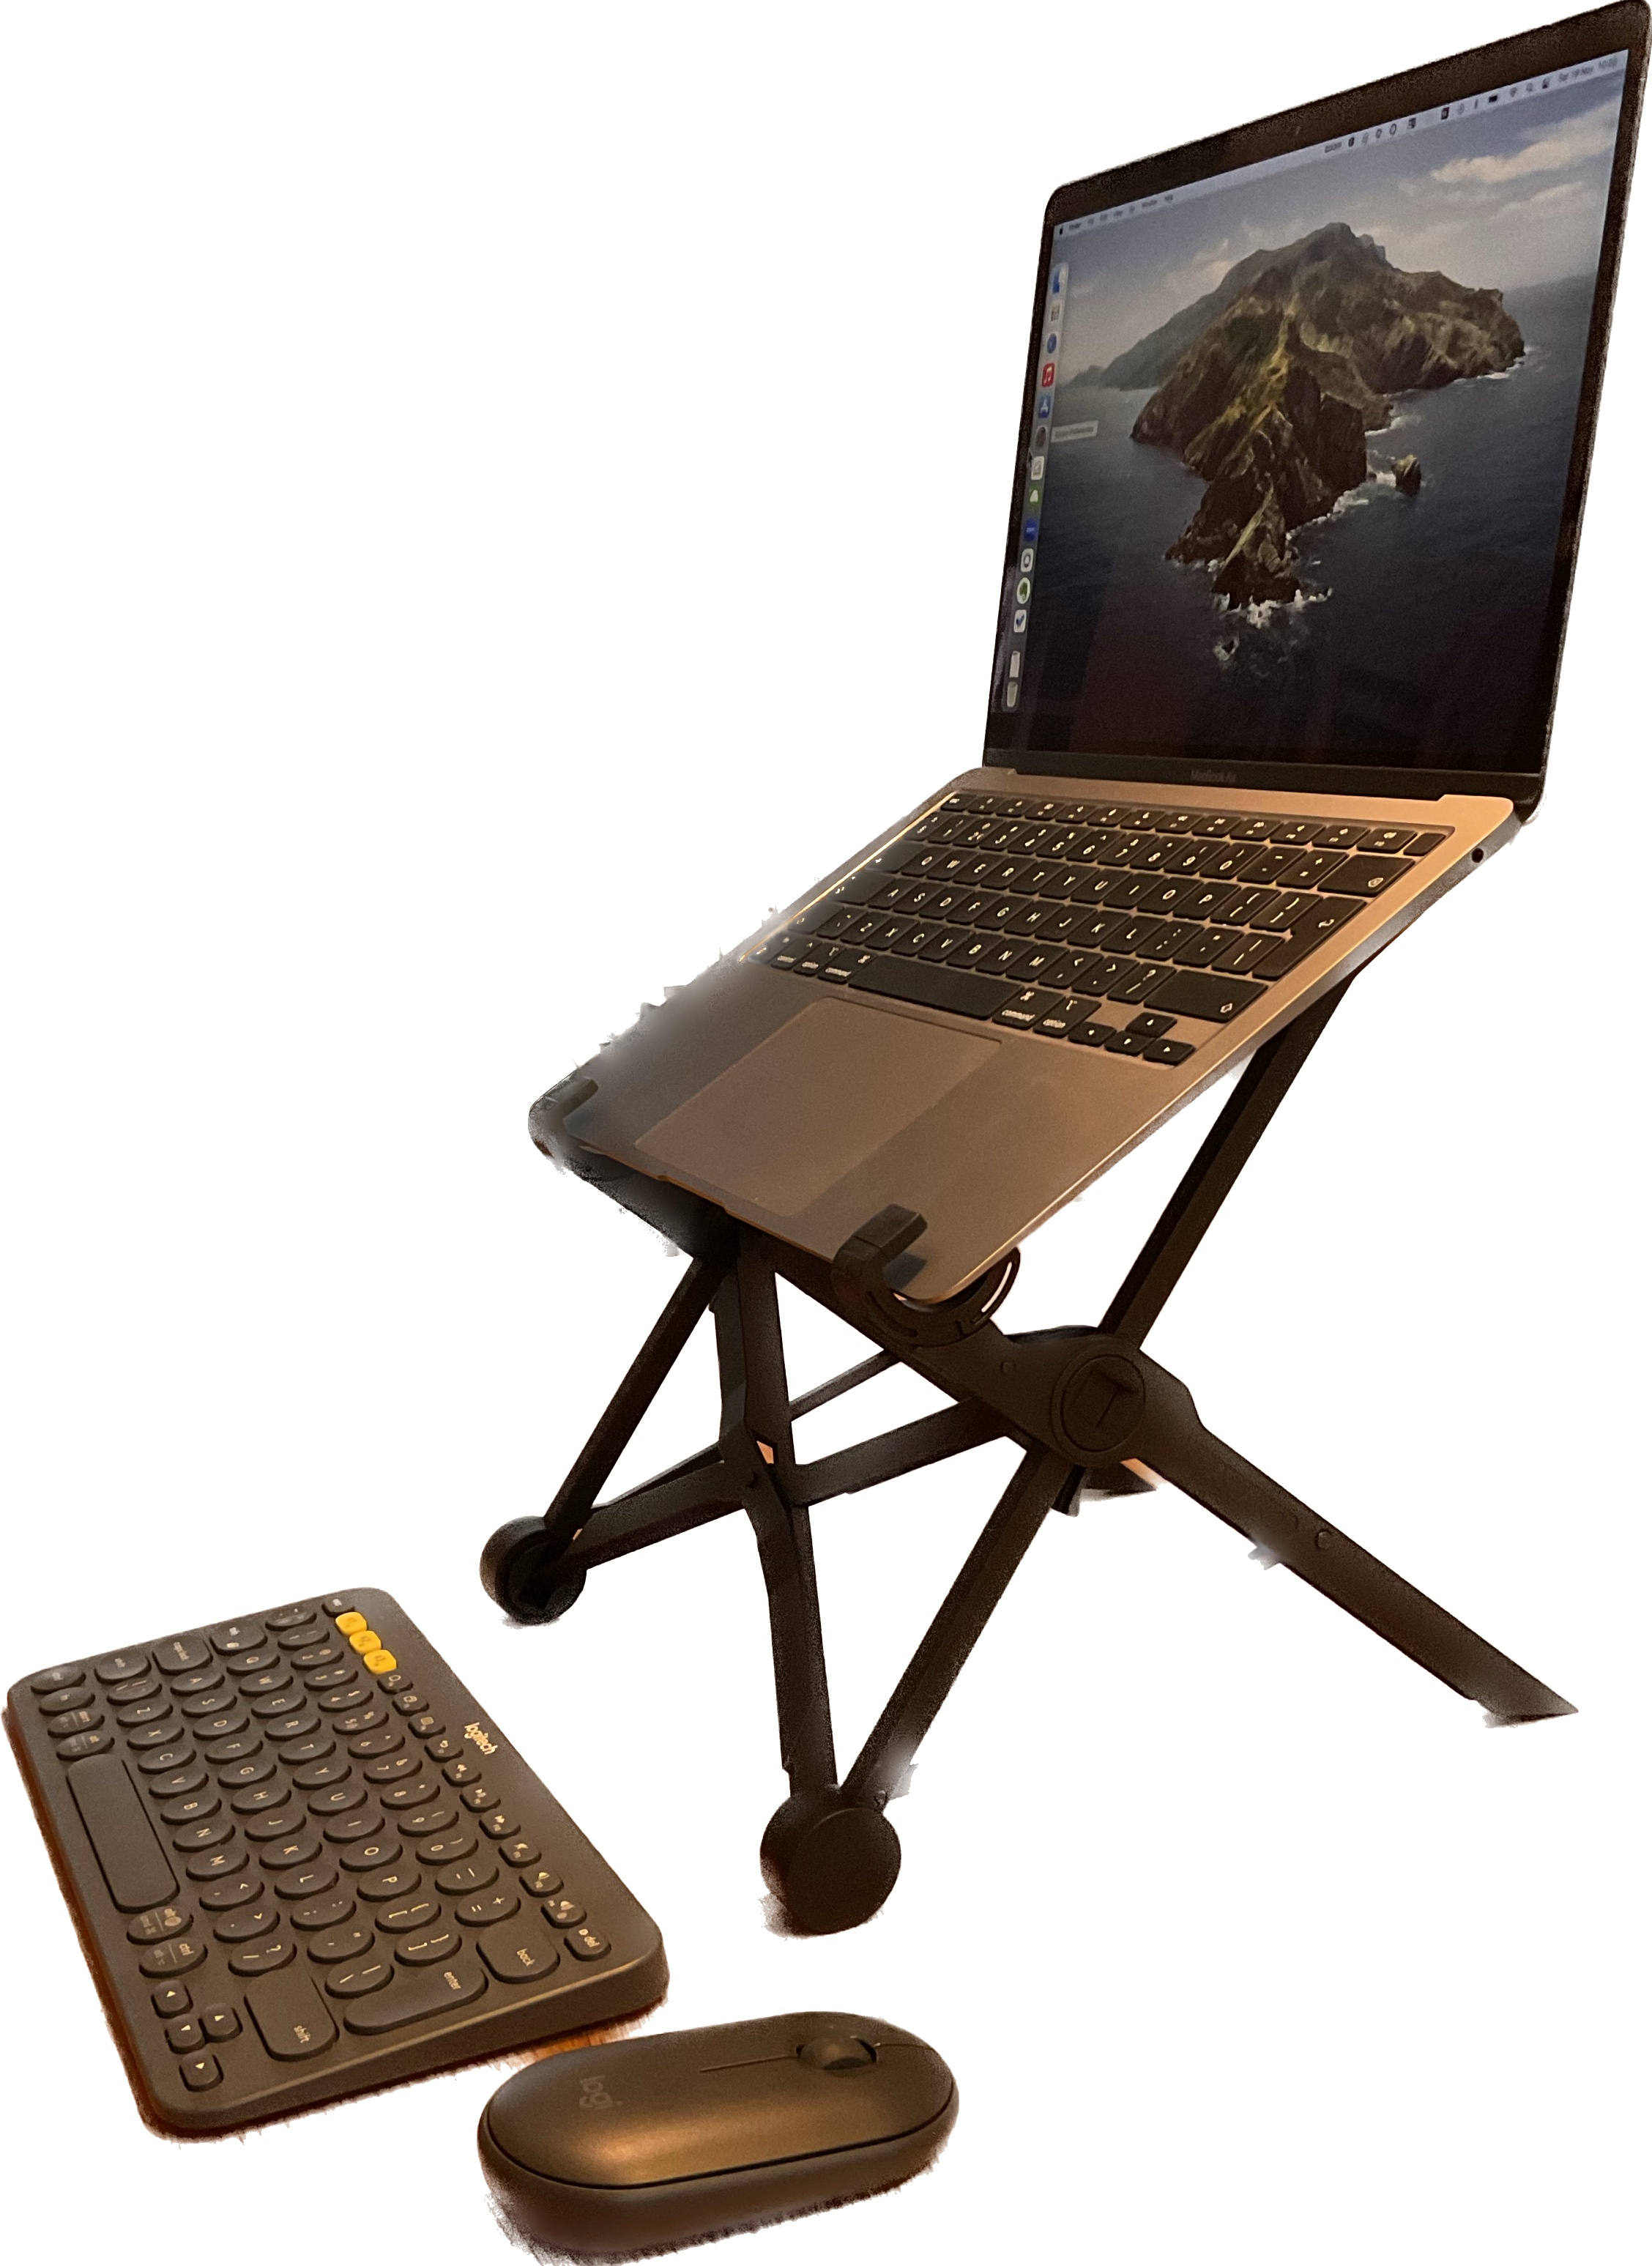
I’m working on a laptop for some time now. When I work in my home office I can hook up an external monitor and full size keyboard/mouse. When I work on the go like in the library or coffeeshop I use the nextstand and the Logitech K380/pebble.
The nextstand raises the laptop high enough so it is level with my eyes. It folds into a small stick that can easily fit into my bag. From all the stands I’ve used this one checks all the boxes. It looks fragile but seems to hold up without problems for about 3 months now.
Both the keyboard (K380) and mouse (pebble) are connected via bluetooth. They are battery powered and use little power. When the batteries are depleted I’ll put in rechargeables. The typing experience is awesome: feels just like the MacBook keyboard with enough travel and feedback. I would appreciate some extra buttons on the mouse though.
Small extra weight for good laptop ergonomics on the go.
We’re working on our technical debt and moved the Syncfusion upgrade into our sprint. Time to get this done since it was long overdue. Turned out this was easy with a little aftermath.
Since we only used the ejGrid in this part of the system we we’re done in just 4 steps:
1
Upgrade nugets
We updated all nugets to the latest versions. This was v20.3.0.56 for Syncfusion.Asp.Mvc5 and v3.6.1 for jQuery
2
Insert license in global.asax
As described on their page we needed to add our license string to the global.asax.cs file. If not added you’ll get a red banner.
3
Add js files to bundle
The old version javascript file were forgiving when omitting some. Now we needed to add jsrender.min.js and ej.tooltip.min.js.
4
Breaking changes
We noticed two breaking changes. One manifested build time: EditingType.Dropdown became DropdownEdit. The other was found during testing: toolbar icon customisation changed – we removed the icon and are using text now
The toolbar icons were a bit of a struggle. Right after the upgrade the icons were displayed twice and the text was not visible. To get things going we replaced the icon + text by text-only and moved on to demo this to our product owner.
We’ve created an R Shiny app for viewing data. On the server we log the time needed to query the database. The users report longer waiting times than the query time we log. What is R Shiny doing?
We can see that a query that takes 0.1 seconds takes 1.2 seconds (previous green message until last red message) before the user sees the result. This is caused by the amount of data that is returned. The difference of 1 second is not something a user wil notice.
Imagine a query that takes 3 seconds and produces a lot of data. Then the user will wait for a lot longer and the query time is way off from what the user experiences. Also the rendering of the actual table will be slower since it has more data to process. We need to know the time it takes to show the data to the user.
The data is displayed with DT (https://rstudio.github.io/DT/) which has all sorts of events. The callback is most promising and fires some javascript after the data is presented to the user. So we wrote some code to send this event back to the server and log the time it needed for the data to be send and the callback was fired. The code looked something like this:
We now have a better understanding of the user experience when it comes to response times. The query was fast enough, but the rendering took too long. Now we can start fixing this.
We use AutoMapper in almost all of our solutions. The recent new version forced us to finally refactor the way we used to resolve external dependencies. As you can read here (https://docs.automapper.org/en/latest/12.0-Upgrade-Guide.html) the ServiceCtor was removed.
Nugets
First we upgraded the AutoMapper nuget and added the dependency injection nuget as described here (https://docs.automapper.org/en/latest/Dependency-injection.html) Now we kan call this code in our startup and AutoMapper will be added with all dependencies available.
We used to create files to configure an MapperConfiguration and created the Mapper from there. The code looked something like this:
// this is ** NOT ** what we want
public class AutoMapperConfiguration : MapperConfiguration {
   public static Action<IMapperConfigurationExpression> Config {
      get {
         return config => config.CreateMap< .... >
            .ConvertUsing(source, destination, context => context.Options.ServiceCtor.Invoke(typeof(ILogger)).LogWarning("something"));
      }
   }
}
The new way of using dependency injection (already introduced in v5) is to use the provided interfaces and inject the dependency into the implementing class. These interfaces are described here (https://docs.automapper.org/en/latest/index.html#extensibility) The code below shows a simple mapping with some logging.
// this is mush cleaner
public class ProfileWithLogging : Profile {
   public ProfileWithLogging() {
      CreateMap<A, B>().ConvertUsing<LoggingTypeConverter>();
   }
}

public class LoggingTypeConverter : ITypeConverter<A, B> {
   private readonly ILogger _logger;
   public LoggingTypeConverter(Ilogger logger) { _logger = logger; }
   public B Convert(A source, B destination, ResolutionContext context) {
      _logger.LogInformation("Mapping A to B");
   }
}
Not sure what this does to speed or memory usage. The code looks a lot cleaner and we updated to the latest version – happy coder 🙂
disclaimer – source code may not compile and is for illustration purposes – use on your own risk
We use SonarQube to scan our code (see Adding SonarQube to TFS build) and have version 8 LTS up-and-running for some time now. The upgrade to SonarQube 9 and future version 9 LTS is upcoming. Here is how we prepare for the upgrade.
Run SonarQube 9
According to the requirements for SonarQube we need the Java 11 runtime for the server. This is already available along with the other requirements because they are the same for running our version 8 LTS.
For testing purpose we create another database (upgrade test planned for another time) and put that connectionstring in the configuration. We configure other ports for the Web UI and ElasticSearch so we can run both version 8 and 9 at the same time on our server. After a few attempts we get everything right and see the “Sonarqube is up” message on the console.
Run Azure devops build
Our platform team installed the Java 17 runtime on a few build agents. This is needed for the scanners or we get errors. To make sure we use the correct Java runtime we set the environment variable JAVA_HOME to point to Java 17 in the task (like https://marketplace.visualstudio.com/items?itemName=Hey24sheep.envar) before the Run Code Analysis task.
In the Prepare Analysis task we needed to set the timeout property (sonar.ws.timeout) to 2 minutes. This might be caused by running two instances of SonarQube on one server.
For use of the new SonarQube 9 instance we needed to create a new service endpoint with a generated token. Here comes the first real difference – tokens are now more specific.
You need specific rights to create a project and specific rights to run analysis for a project. There is one token type that contains both rights but you should not use it for running analysis. So we need to create the project (and get a project key) by hand so the build can run analysis with the analysis token. More details about tokens: https://docs.sonarqube.org/latest/user-guide/user-token/
The analyses worked as expected and a report is available in the SonarQube 9 web ui.
Plugins
We have some custom plugins. Most can be removed after buying a license. But the R code plugin was the odd one. Luckily we had no problems running analysis with the plugin after copying it from the version 8 instance.