
I’ve been using the GhostDoc extension from SubMain for some time. It puts those triple slash (///) documentation tags above my csharp code for me. All I have to do is hit some shortcut keys. Although I never posted about it, I highly recommend it.
This post is about TestMatrix, another product from SubMain. It provides a test runner, code coverage and test profiler as an Add-in for Visual Studio 2005 up to 2012. Since this is an Add-in the express edition is not supported.
The installation requires the dotNET 2.0 framework which my Windows 8.1 Hyper-V machine had not installed. After correcting that, the setup was a breeze.
TestMatrix makes itself visible in Visual Studio with a Menu and some panels.
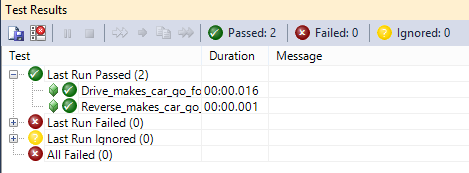
Test runner
The test runner panel looks like the testresults panel in Visual 2005 – 2010. Since I installed it in Visual Studio 2012, it gave my environment a retro look ;). So far so good.
Code coverage
Next I wanted to see my code coverage. Enabled it in the Menu, but got no results. Looked in the output window and found logging of created coverage results. Also the testrunner notified me about performance penalties when using code coverage. But no results.
After some digging the answer was the Forcex86 setting in the Options dialog. Why not make this the default?
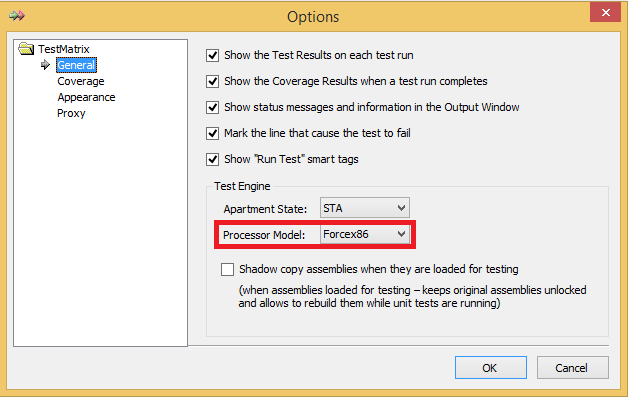
Now the code coverage is not only measured, it is also presented in the panel. The checkboxes in the top are for filtering the results. Nice feature.

Test profiler
Last the test profiler. This shows the execution time of and number of calls to my (test) methods.
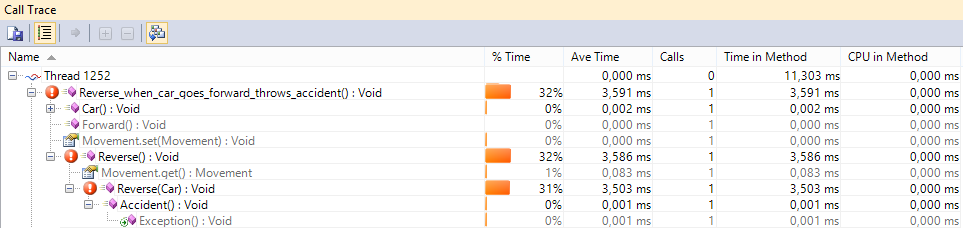
Hmm, throwing exceptions is slow
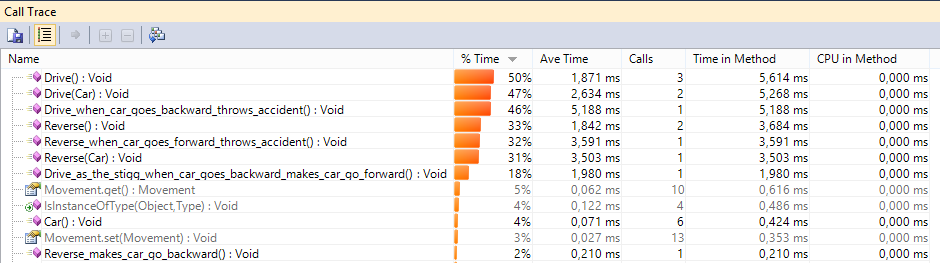
The view can be altered to view a “heatmap” of most called methods. But remember this is measured during unit tests and may not be re-presentable for user actions.
Conclusion
TestMatrix is compatible with Visual Studio Professional and up, not express.
When you have Visual Studio Premium or Ultimate code coverage is included. The only adition would be the profiling. Which is nice, but not a deal closer.
For Visual Studio Professional the code coverage feature is the reason to buy this with the test profiler as a nice bonus.
