R Shiny dashboard inspection with profvis

We’re building a R Shiny dashboard to display big datasets. In our production environment we sometimes experience slow performance. Profiling with the profvis package is our plan to fix this.

The profvis package needs to be installed. Then it can be used by encapsulating the startcode in a profvis call.

# only once
install.packages("profvis")

# in your startcode
library(profvis)
profvis({
   shiny::runApp(app)
})

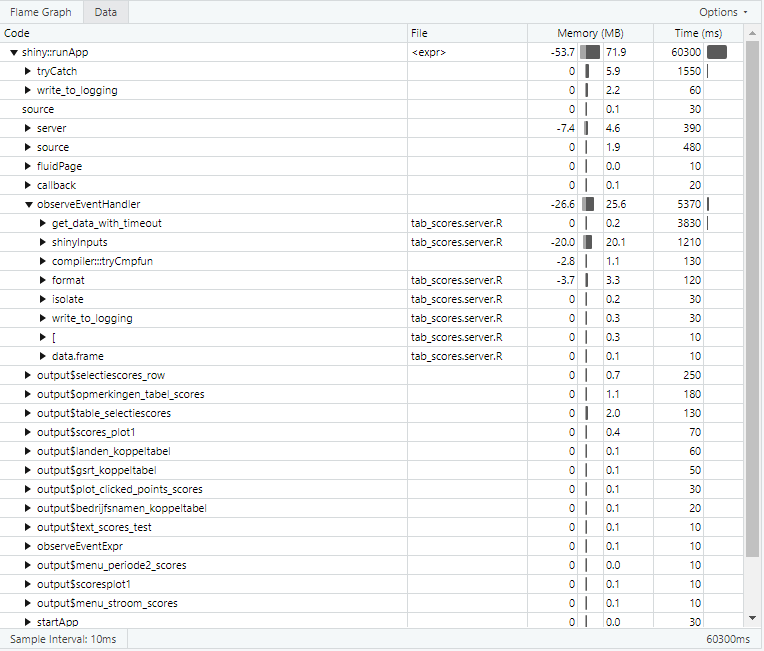
After the R Shiny dashboard starts we followed a test scenario and stopped the app. Then R Studio showed us the profile data in two tabs (images below). One tab with a flame graph so you can see the spikes in (wait) time / memory during the test scenario. The other tab shows the same data in a table per file / function.
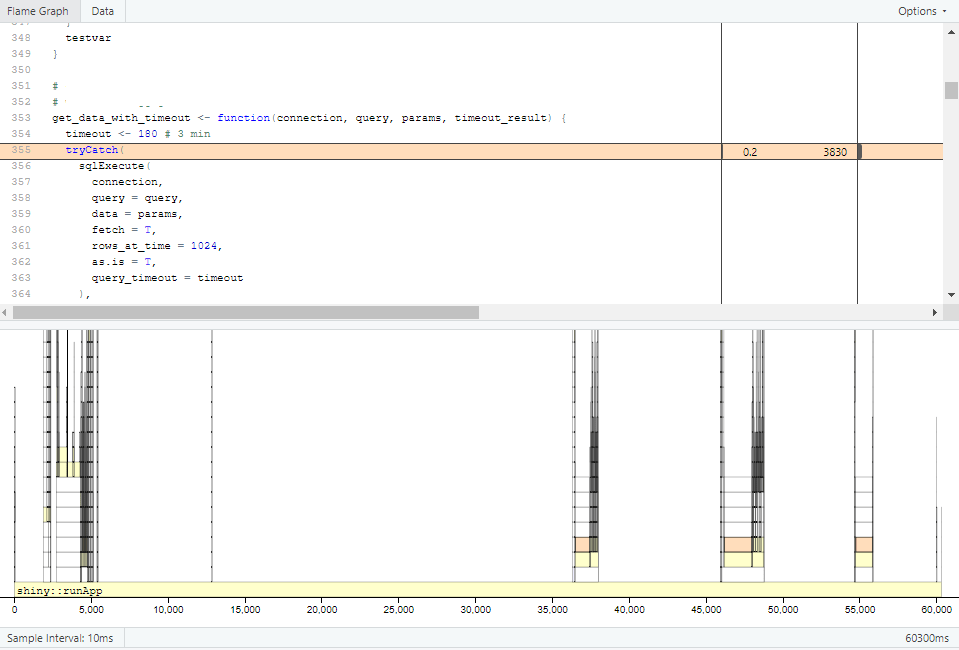
Flame Graph tab with memory and time per code line
Data tab with memory and time per file/function

We now have a better understanding where our dashboard is performing less optimal. After changing the code we can start another profvis session to see if the changes fix or add to the problem.

References

About erictummers

Working in a DevOps team is the best thing that happened to me. I like challenges and sharing the solutions with others. On my blog I’ll mostly post about my work, but expect an occasional home project, productivity tip and tooling review.
This entry was posted in Uncategorized and tagged , . Bookmark the permalink.

Leave a Reply

Fill in your details below or click an icon to log in:

WordPress.com Logo

You are commenting using your WordPress.com account. Log Out /  Change )

Twitter picture

You are commenting using your Twitter account. Log Out /  Change )

Facebook photo

You are commenting using your Facebook account. Log Out /  Change )

Connecting to %s

This site uses Akismet to reduce spam. Learn how your comment data is processed.